

Pre-sales project · 2025
Reimagining car leasing for the digital age
Designing
car leasing for
the digital age
Designing
car leasing for
the digital age
FleetPartner needed a unified platform where individuals lease a single car and corporations manage entire fleets without two separate products.
FleetPartner needed a unified platform where individuals lease a single car and
corporations manage entire fleets — without two separate products.
My Role
Senior UX Designer
Project
Pre-sales Project
Company
FleetPartner
FleetPartner
Users Served
Individuals & Corporate Fleets
Core Problem
Complex leasing made transparent and self-serve
Deliverables
Research and Prototype
Research · IA Prototype Design System
Company
FleetPartner
Core Problem
Complex leasing made transparent and self-serve
Users Served
Individuals & Corporate Fleets
Deliverables
Research · IA Prototype Design System
01 · Problem Defination
Why leasing felt broken
Why leasing felt broken
Car leasing is inherently complex yet existing digital touchpoints forced users through phone calls, PDFs, and opaque pricing models. FleetPartner's goal was to change that for two very different user types.

Individual Lessees
No clarity on how yearly km directly impacts monthly cost
Confusion about who is responsible for what service vs. damage
No real-time visibility into lease progress or remaining km
Overwhelming vehicle configuration process with no guidance
No digital channel to report incidents or track service requests

Corporate Fleet Managers
Managing 10–200 vehicles via spreadsheets and email threads
Managing 10–200 vehicles via spreadsheets and email threads
No consolidated view of fleet wide cost, utilisation, and km across drivers
No consolidated view of fleet wide cost, utilisation, and km across drivers
Onboarding new drivers required manual paperwork and delays
Onboarding new drivers required manual paperwork and delays
Damage reporting was reactive no audit trail or accountability
Damage reporting was reactive no audit trail or accountability
Renewal cycles managed ad-hoc with no proactive reminders
Renewal cycles managed ad-hoc with no proactive reminders
Why leasing felt
broken
02 · Research & Insights
02 · Research & Insights
What users actually needed
What users actually needed
All data we assumed based on the internal team insights as it is a pre-sales pitch project to show the client.
01
The km slider is the decision engine
73% of users said "how much I drive per year" was the first thing they wanted to configure. Pricing needed to be built around this interaction, not buried in a summary.
02
Responsibility confusion causes anxiety
Users consistently misunderstood who handles servicing vs. who pays for scratches. Clear, persistent ownership indicators dramatically reduce support calls.
03
Fleet managers think in cohorts, not cars
Corporate users cared about cost-per-driver and fleet health score not individual vehicle specs. The UI had to support a birds-eye view with drill down.
04
Damage reporting has emotional weight
Users feared reporting damage because the process felt punitive. A guided, step-by-step report flow with photo capture reduced abandonment by removing ambiguity.
02
Responsibility confusion causes anxiety
Users consistently misunderstood who handles servicing vs. who pays for scratches. Clear, persistent ownership indicators dramatically reduce support calls.
03
Fleet managers think in cohorts, not cars
Corporate users cared about cost-per-driver and fleet health score not individual vehicle specs. The UI had to support a birds-eye view with drill down.
04
Damage reporting has emotional weight
Users feared reporting damage because the process felt punitive. A guided, step-by-step report flow with photo capture reduced abandonment by removing ambiguity.
👨
Markus, 34
Individual Lessee · Software Engineer
Predictable costs
Digital first
No surprises
Clear responsibility
"I drive about 18,000 km a year. I just want to know exactly what it costs and what I'm responsible for before I sign anything."
👩
Sandra, 41
Fleet Manager · Logistics Company
Fleet overview
Cost control
Audit trails
"I manage 60 vehicles. I need one screen that shows me everything, who's driving what, which cars are due for renewal, and which drivers have open damage reports."
👨
Dirk, 34
Individual Lessee · Software Engineer
Predictable costs
Digital first
No surprises
Clear responsibility
"I drive about 10,000 km a year. I just want to know exactly what it costs and what I'm responsible for before I sign anything."
👩
Kavya, 41
Fleet Manager · Logistics Company
Fleet overview
Cost control
Audit trails
"I manage 60 vehicles. I need one screen that shows me everything, who's driving what, which cars are due for renewal, and which drivers have open damage reports."
03 · Design Principles
Six principles that guided every decision
Six principles that guided every decision
These weren't aspirational slogans each principle mapped directly to a validated pain point and had a testable UX implication.
01
Km-First Pricing Transparency
The annual km selector is the primary input of the leasing configurator. Price updates in real-time, ensuring the core business variable drives the user journey not the other way around.
Business Alignment
02
Explicit Responsibility Ownership
FleetPartner owns servicing. The user owns external damage. This split must be visible everywhere onboarding, lease summary, and contextually surfaced in the damage reporting flow.
Trust & Clarity
03
One Platform, Two Lenses
Individual and corporate users share the same underlying system. The interface adapts based on account type same design system, different information architecture and entry points.
Scalability
04
Progressive Disclosure
Complex lease details are available but never forced on the user. Defaults are intelligent, and advanced configuration is revealed only when the user signals readiness to go deeper.
Cognitive Load
05
Proactive, Not Reactive
The platform surfaces timely alerts km overrun warnings, upcoming renewals, pending damage reports rather than waiting for users to discover issues through support channels.
Engagement
06
Guided Recovery for Stressful Moments
Damage reporting is emotionally charged. The flow uses empathetic copy, step-by-step guidance, and immediate acknowledgment to transform a dreaded interaction into a manageable one.
Emotional Design
04 · Information Architecture
Core user flows
We mapped the end-to-end journey for both user types, identifying where their needs diverge and where shared infrastructure could serve both efficiently.
Individual
Lease a Car
Select vehicle category
Filter by segment, fuel type, and budget range. Intelligent defaults based on profile.
Configure km per year
Km slider is hero of the page. Monthly price updates live as user adjusts.
Responsibility briefing
One-screen explainer: FleetPartner covers service. User covers external damage.
Review & sign digitally
Full summary with cost breakdown, contact, and e-signature. No PDFs.
Dashboard activated
Live km tracker, service status, damage report access, renewal countdown.

Corporate
Fleet Management
Fleet overview dashboard
Birds-eye view: active vehicles, total monthly cost, km utilisation across drivers.
Add vehicle / driver
Bulk import via CSV or manual entry.
Driver assigned to vehicle with defined km allowance.
Per-vehicle drill-down
Same individual lease view but accessible by fleet manager on behalf of driver.
Alerts detection
Proactive notifications: overrun km, upcoming renewals, open damage reports.
Reporting & export
Monthly cost reports per vehicle, per driver, or total fleet. Export to CSV / ERP.
05 · Translating Business Rules to UX
How the three core business rules shaped design
How the three core business rules shaped design
FleetPartner's business model had three rules with direct UX implications. Each required deliberate interface decisions to make them clear without being burdensome.
📏
Leasing amount depends on yearly km
The km allowance is the primary cost driver. This is not immediately intuitive to users who expect price to be fixed by car model alone.
UX Response: The km slider is the first and largest interactive element in the configurator. Price updates live with every adjustment. A cost-per-km indicator shows the efficiency of higher allowances. Users cannot proceed without setting a km value.
🔧
Vehicle servicing is FleetPartner's responsibility
This is a core value proposition but often unknown to new lessees, who historically called support every time a service light appeared.
UX Response: A "Service Status" widget on the dashboard shows current service health in green. Contextual tooltips throughout the app reiterate this. The onboarding responsibility screen makes it the first thing users learn.
⚠️
External damage is the user's responsibility
This is the most anxiety-inducing aspect of leasing. Users fear ambiguity about what counts as "external damage" and what the financial consequences are.
UX Response: The damage reporting flow opens with a clear definition and examples. A pre-lease photo documentation step gives users a baseline record. Damage report history is always accessible in the app with status updates.
Polished Interface Design
Polished Interface Design

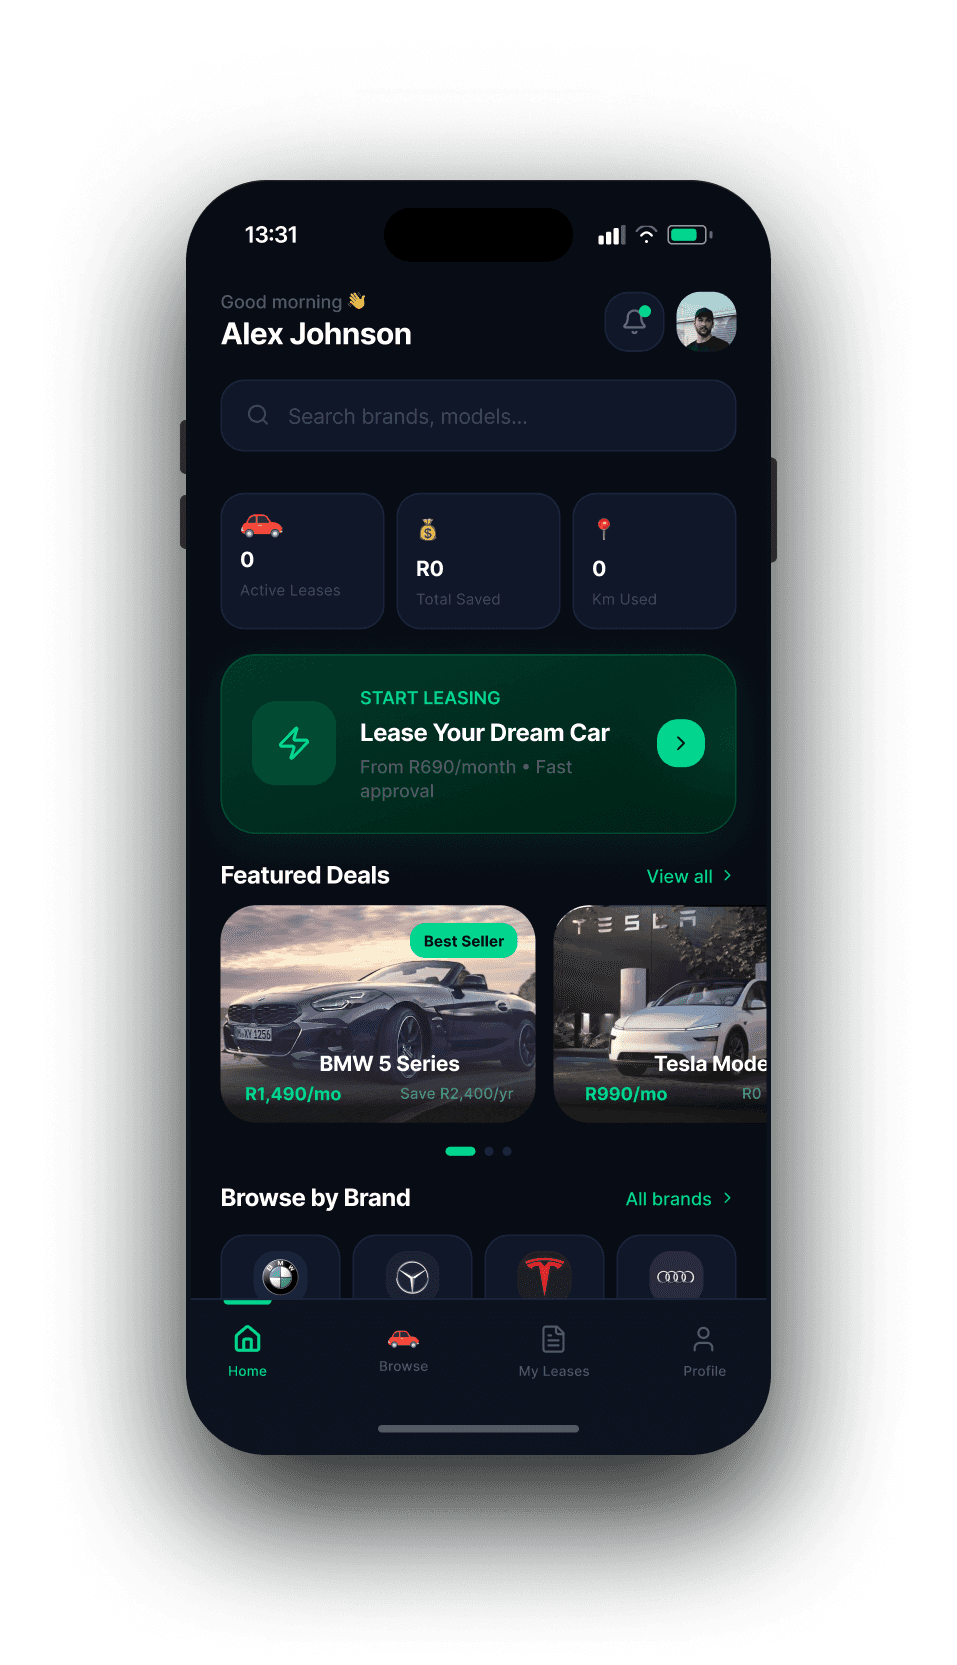
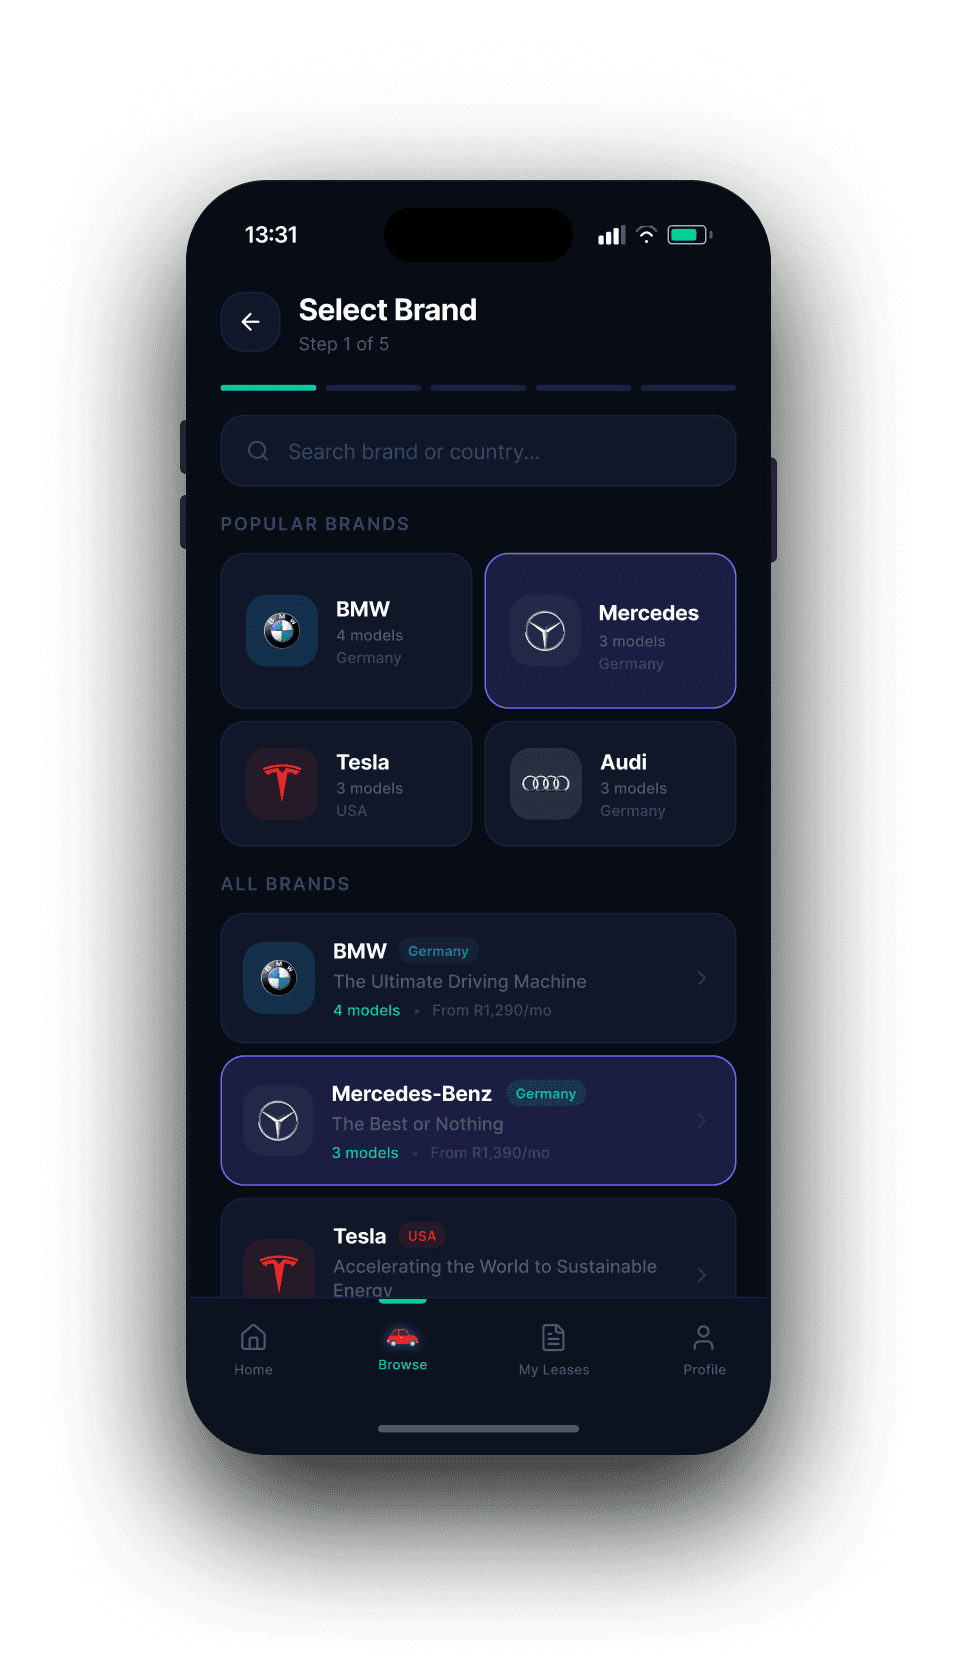


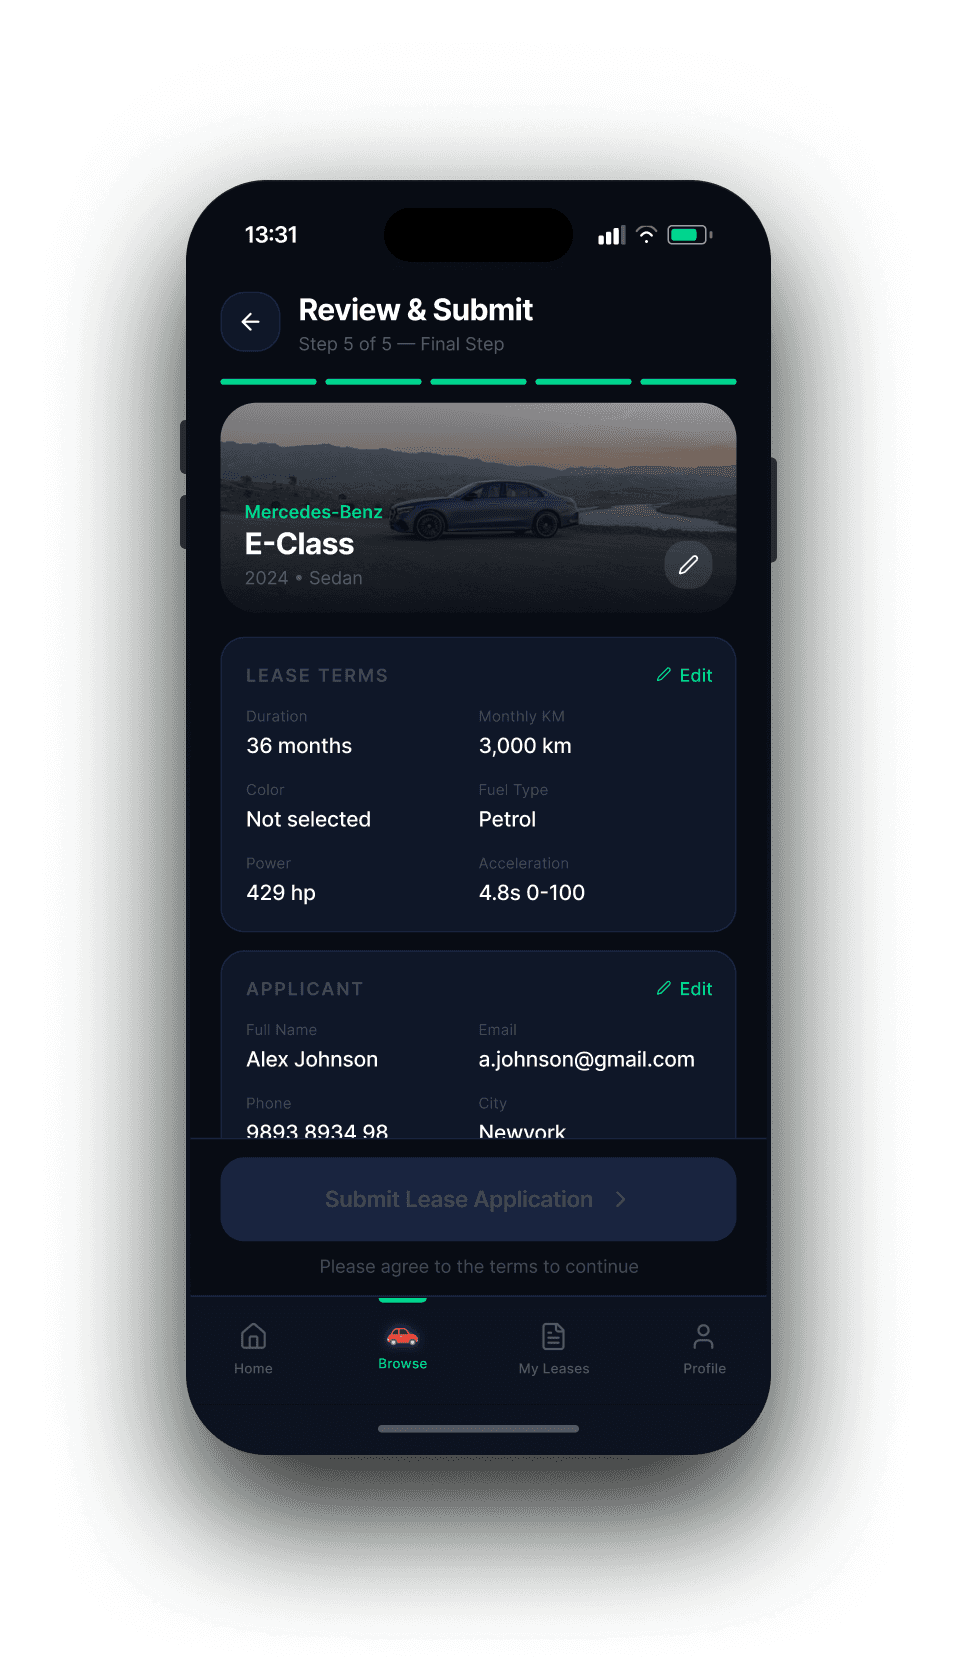


06 · interface design
07 · Reflection
What worked and what's next
What worked and what's next
Every project surfaces lessons. Here's an honest look at what landed well and where I'd invest additional design effort in the next phase.
✅ What worked well
The km-first configurator dramatically reduced pricing confusion, it was the right call to make it the interaction centrepiece, not an advanced setting.
Shared design system for both user types saved development time and created cohesion across the two dashboards, users recognised the product immediately.
Early alignment with legal and product on the responsibility split copy prevented late-stage revisions that would have derailed the timeline.
Staged usability testing (low fi - mid fi - high fi) caught the damage report abandonment issue early, before a single line of production code was written.
🔭 What I'd improve next
The km overrun upgrade flow needs more persuasive design, users understand the warning but hesitate to act. A cost comparison overlay would help.
Fleet reporting features were descoped for MVP. Corporate users still export to Excel. A built-in analytics module is the highest-priority backlog item.
Accessibility was addressed structurally (contrast, focus states, ARIA) but we did not run a full WCAG 2.1 AA audit before launch this is planned for Q2.
The mobile experience was a direct adaptation of the web design rather than a ground-up mobile-first approach. A native mobile redesign would unlock richer damage reporting with camera integration.
Prototype
02 · Research & Insights
What users actually needed
We conducted 18 user interviews (11 individual lessees, 7 fleet managers), a competitive audit of 6 competitors, and a survey of 200 FleetPartner existing customers to extract behavioural patterns.
01
The km slider is the decision engine
73% of users said "how much I drive per year" was the first thing they wanted to configure. Pricing needed to be built around this interaction, not buried in a summary.
02
Responsibility confusion causes anxiety
Users consistently misunderstood who handles servicing vs. who pays for scratches. Clear, persistent ownership indicators dramatically reduce support calls.
03
Fleet managers think in cohorts, not cars
Corporate users cared about cost-per-driver and fleet health score not individual vehicle specs. The UI had to support a birds-eye view with drill down.
04
Damage reporting has emotional weight
Users feared reporting damage because the process felt punitive. A guided, step-by-step report flow with photo capture reduced abandonment by removing ambiguity.
👨
Markus, 34
Individual Lessee · Software Engineer
Predictable costs
Digital first
No surprises
Clear responsibility
"I drive about 18,000 km a year. I just want to know exactly what it costs and what I'm responsible for before I sign anything."
👩
Sandra, 41
Fleet Manager · Logistics Company
Fleet overview
Cost control
Audit trails
"I manage 60 vehicles. I need one screen that shows me everything, who's driving what, which cars are due for renewal, and which drivers have open damage reports."
03 · Design Principles
Six principles that guided every decision
These weren't aspirational slogans each principle mapped directly to a validated pain point and had a testable UX implication.
01
Km-First Pricing Transparency
The annual km selector is the primary input of the leasing configurator. Price updates in real-time, ensuring the core business variable drives the user journey not the other way around.
Business Alignment
02
Explicit Responsibility Ownership
FleetPartner owns servicing. The user owns external damage. This split must be visible everywhere onboarding, lease summary, and contextually surfaced in the damage reporting flow.
Trust & Clarity
03
One Platform, Two Lenses
Individual and corporate users share the same underlying system. The interface adapts based on account type same design system, different information architecture and entry points.
Scalability
04
Progressive Disclosure
Complex lease details are available but never forced on the user. Defaults are intelligent, and advanced configuration is revealed only when the user signals readiness to go deeper.
Cognitive Load
05
Proactive, Not Reactive
The platform surfaces timely alerts km overrun warnings, upcoming renewals, pending damage reports rather than waiting for users to discover issues through support channels.
Engagement
06
Guided Recovery for Stressful Moments
Damage reporting is emotionally charged. The flow uses empathetic copy, step-by-step guidance, and immediate acknowledgment to transform a dreaded interaction into a manageable one.
Emotional Design
We mapped the end-to-end journey for both user types, identifying where their needs diverge and where shared infrastructure could serve both efficiently.
Corporate
Fleet Management
Individual
Lease a Car
Select vehicle category
Filter by segment, fuel type, and budget range. Intelligent defaults based on profile.
Configure km per year
Km slider is hero of the page. Monthly price updates live as user adjusts.
Responsibility briefing
One-screen explainer: FleetPartner covers service. User covers external damage.
Review & sign digitally
Full summary with cost breakdown, contact, and e-signature. No PDFs.
Dashboard activated
Live km tracker, service status, damage report access, renewal countdown.
Fleet overview dashboard
Birds-eye view: active vehicles, total monthly cost, km utilisation across drivers.
Add vehicle / driver
Bulk import via CSV or manual entry.
Driver assigned to vehicle with defined km allowance.
Per-vehicle drill-down
Same individual lease view but accessible by fleet manager on behalf of driver.
Alerts detection
Proactive notifications: overrun km, upcoming renewals, open damage reports.
Reporting & export
Monthly cost reports per vehicle, per driver, or total fleet. Export to CSV / ERP.
Core user flows
04 · Information Architecture
Individual
Lease a Car
Select vehicle category
Filter by segment, fuel type, and budget range. Intelligent defaults based on profile.
Configure km per year
Km slider is hero of the page. Monthly price updates live as user adjusts.
Responsibility briefing
One-screen explainer: FleetPartner covers service. User covers external damage.
Review & sign digitally
Full summary with cost breakdown, contact, and e-signature. No PDFs.
Dashboard activated
Live km tracker, service status, damage report access, renewal countdown.
Polished Interface Design
08 · Reflection
What worked and what's next
Every project surfaces lessons. Here's an honest look at what landed well and where I'd invest additional design effort in the next phase.
✅ What worked well
The km-first configurator dramatically reduced pricing confusion, it was the right call to make it the interaction centrepiece, not an advanced setting.
Shared design system for both user types saved development time and created cohesion across the two dashboards, users recognised the product immediately.
Early alignment with legal and product on the responsibility split copy prevented late-stage revisions that would have derailed the timeline.
Staged usability testing (low fi - mid fi - high fi) caught the damage report abandonment issue early, before a single line of production code was written.
🔭 What I'd improve next
The km overrun upgrade flow needs more persuasive design, users understand the warning but hesitate to act. A cost comparison overlay would help.
Fleet reporting features were descoped for MVP. Corporate users still export to Excel. A built-in analytics module is the highest-priority backlog item.
Accessibility was addressed structurally (contrast, focus states, ARIA) but we did not run a full WCAG 2.1 AA audit before launch this is planned for Q2.
The mobile experience was a direct adaptation of the web design rather than a ground-up mobile-first approach. A native mobile redesign would unlock richer damage reporting with camera integration.
Prototype
05 · Translating Business Rules to UX
How the three core business rules shaped design
FleetPartner's business model had three rules with direct UX implications. Each required deliberate interface decisions to make them clear without being burdensome.
📏
Leasing amount depends on yearly km
The km allowance is the primary cost driver. This is not immediately intuitive to users who expect price to be fixed by car model alone.
UX Response: The km slider is the first and largest interactive element in the configurator. Price updates live with every adjustment. A cost-per-km indicator shows the efficiency of higher allowances. Users cannot proceed without setting a km value.
🔧
Vehicle servicing is FleetPartner's responsibility
This is a core value proposition but often unknown to new lessees, who historically called support every time a service light appeared.
UX Response: A "Service Status" widget on the dashboard shows current service health in green. Contextual tooltips throughout the app reiterate this. The onboarding responsibility screen makes it the first thing users learn.
⚠️
External damage is the user's responsibility
This is the most anxiety-inducing aspect of leasing. Users fear ambiguity about what counts as "external damage" and what the financial consequences are.
UX Response: The damage reporting flow opens with a clear definition and examples. A pre-lease photo documentation step gives users a baseline record. Damage report history is always accessible in the app with status updates.