
Proof of Delivery
Incture Technologies Pvt Ltd
Transforming last-mile logistics for a leading NYC e-grocery chain through digital innovation and user-centered design.
Mobile & Web
5 Months
Business Impact
100%
Paperless Operations
30%
Efficiency Increase
200+
Active Drivers
$8k
Quarterly Savings
Challenge
Digitizing the Last Mile for Busiest e-Grocery store management
A prominent e-grocery chain operating in the New York City Metropolitan area faced significant operational inefficiencies. Their paper-based order tracking system created bottlenecks, limited visibility, and hindered communication between sales teams, delivery agents, and warehouse supervisors.
The Core Problem
"Delivery agents and warehouse supervisors need a streamlined digital solution that provides real-time visibility and efficient order management because the current paper-based system creates operational inefficiencies, reduces customer satisfaction, and increases delivery costs."
Key Pain Points
No Real-Time Visibility
Dispatchers had zero insight into driver locations, incidents or delivery status.
Paper-Based Chaos
Manual processes caused delays, lost receipts, and high error rates.
Inefficient Routing
Drivers wasted time on unoptimized routes and locating addresses.
Communication Gaps
Limited contact between delivery teams and dispatchers led to reactive problem-solving.
Client
e-Grocery Chain US
Role
UX UI Designer
duration
8 Months
platform
Mobile & Web App
Phase 1: Discovery
Research & Findings
We conducted deep-dive research to understand the ecosystem. This wasn't just about building an app; it was about understanding the human element in a high-pressure logistics environment.
Stakeholder Interviews
10+ interviews with Warehouse Supervisors, Dispatchers, and Delivery Agents.
Field Observation
Shadowed 12 delivery routes and observed peak-hour warehouse operations.
Competitive Analysis
Benchmarked against Instacart, Amazon Fresh, and DoorDash systems.
Critical Insights
1
Delivery Agents
•
Spent 15+ mins/delivery locating addresses and routes.
•
Paper orders caused confusion and errors.
•
No way to communicate delays in real-time if any incident happens.
2
Dispatchers
•
Zero visibility into driver locations.
•
Relied on phone calls for tracking.
•
Assigning the deliveries to delivery agents based on locations
M
Marco
Delivery Agent • 28 years old
"I just want to get my deliveries done without getting lost or dealing with angry customers because I'm late."
Pain Points
Lost Paperwork
Unclear Addresses
No Proof of Delivery
S
Sarah
Dispatch Supervisor • 35 years old
"I need to know where my drivers are so I can manage customer expectations and optimize routes on the fly. And I want to assign the deliveries to agent based on one direction route"
Pain Points
No Visibility
Manual Reporting
Delivery assigning
Phase 2: Define
Success Metrics
We established clear, measurable goals to ensure the solution delivered tangible business value.
Operational Efficiency
Eliminate 100% of paper processes
Reduce delivery time by 20%
Increase daily capacity by 15%
Visibility & Communication
360° real-time visibility
Reduce communication time by 40%
Instant status updates
Business Impact
Reduce operational costs by 25%
Improve CSAT scores by 30%
Decrease incidents by 50%
Target Outcomes
40%
Reduction in communication time
100%
Paperless Operations
Phase 3: Ideate
Mood Board
We mapped out the entire delivery tasks for admin and drivers.

User Flows & Architecture
We mapped out the entire delivery lifecycle to identify critical touchpoints and minimize friction for drivers.
Driver Journey
Logs in & Views Assigned Trips
1
Scans Order QR Code (Verification)
2
Navigates to Address (GPS)
3
Arrives & Updates Status
4
Captures Photo + Signature (POD)
5
Confirms Delivery & Moves to Next
6
Dispatcher Journey
Logs in to Admin Dashboard
1
Creates Trip & Assigns Driver
2
Adds Orders via Geo-fencing
3
Monitors Live Fleet Progress
4
Receives Delay Alerts
5
Resolves Incidents via Workbench
6
Design Principles
Principle 1
Visibility First
Every stakeholder should have real-time access to relevant delivery info.
Principle 2
Simplicity in Motion
Drivers need one-hand operation with large touch targets while on the move.
Principle 3
Error Prevention
Built-in validation (QR scanning) prevents wrong deliveries before they happen.
Phase 4: Design & Prototype
The Solution
A comprehensive dual-platform ecosystem designed for clarity, speed, and reliability.
SAP Fiori Design System

Driver App
Designed for the Road
Dashboard to check shipments & routes
High contrast for outdoor visibility
Offline-first architecture
One-tap navigation integration
One-tap help assistance


Admin Dashboard
Command Center
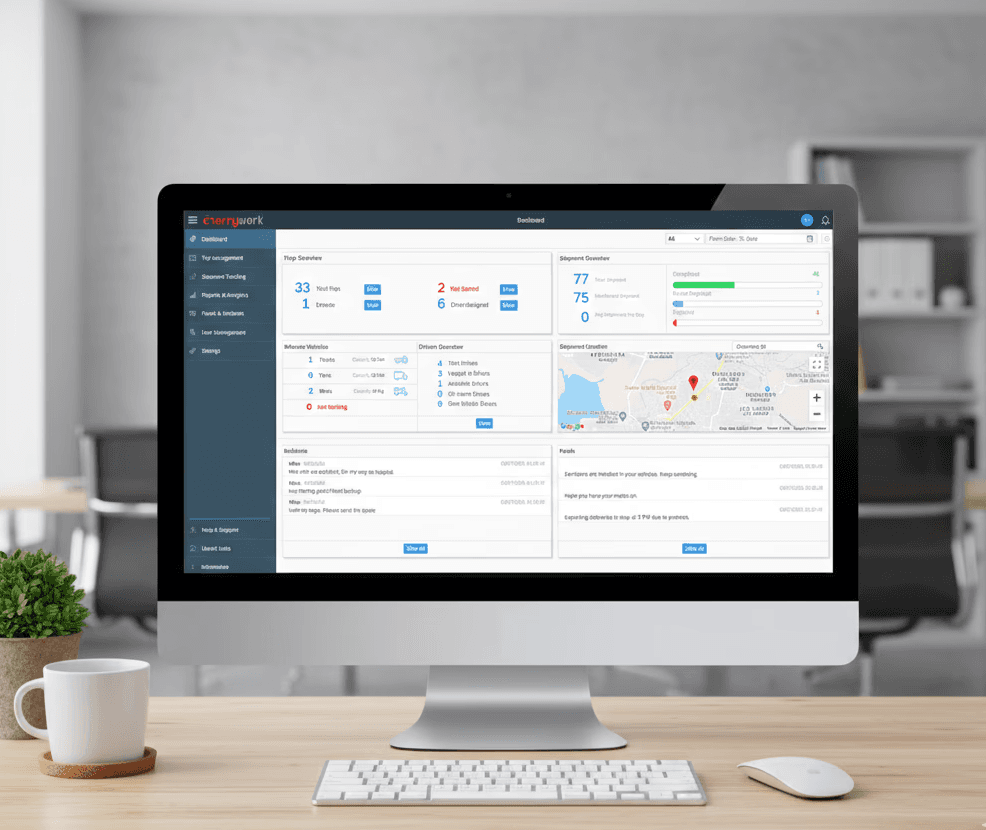
Provides warehouse supervisors or dispatchers with real-time view of delivery agents, shipments, vehicles and customer’s proof of delivery. Features include drag-and-drop trip assignment and real-time incident alerts.
Real-time fleet tracking map
Instant incident notifications
Performance analytics dashboard

Trip Management
Improved delivery efficiency by enabling geofenced trip creation, real-time trip tracking, and structured rejection workflows to help supervisors meet daily delivery quotas
Drag-and-drop route optimization
Manifest the upcoming trips


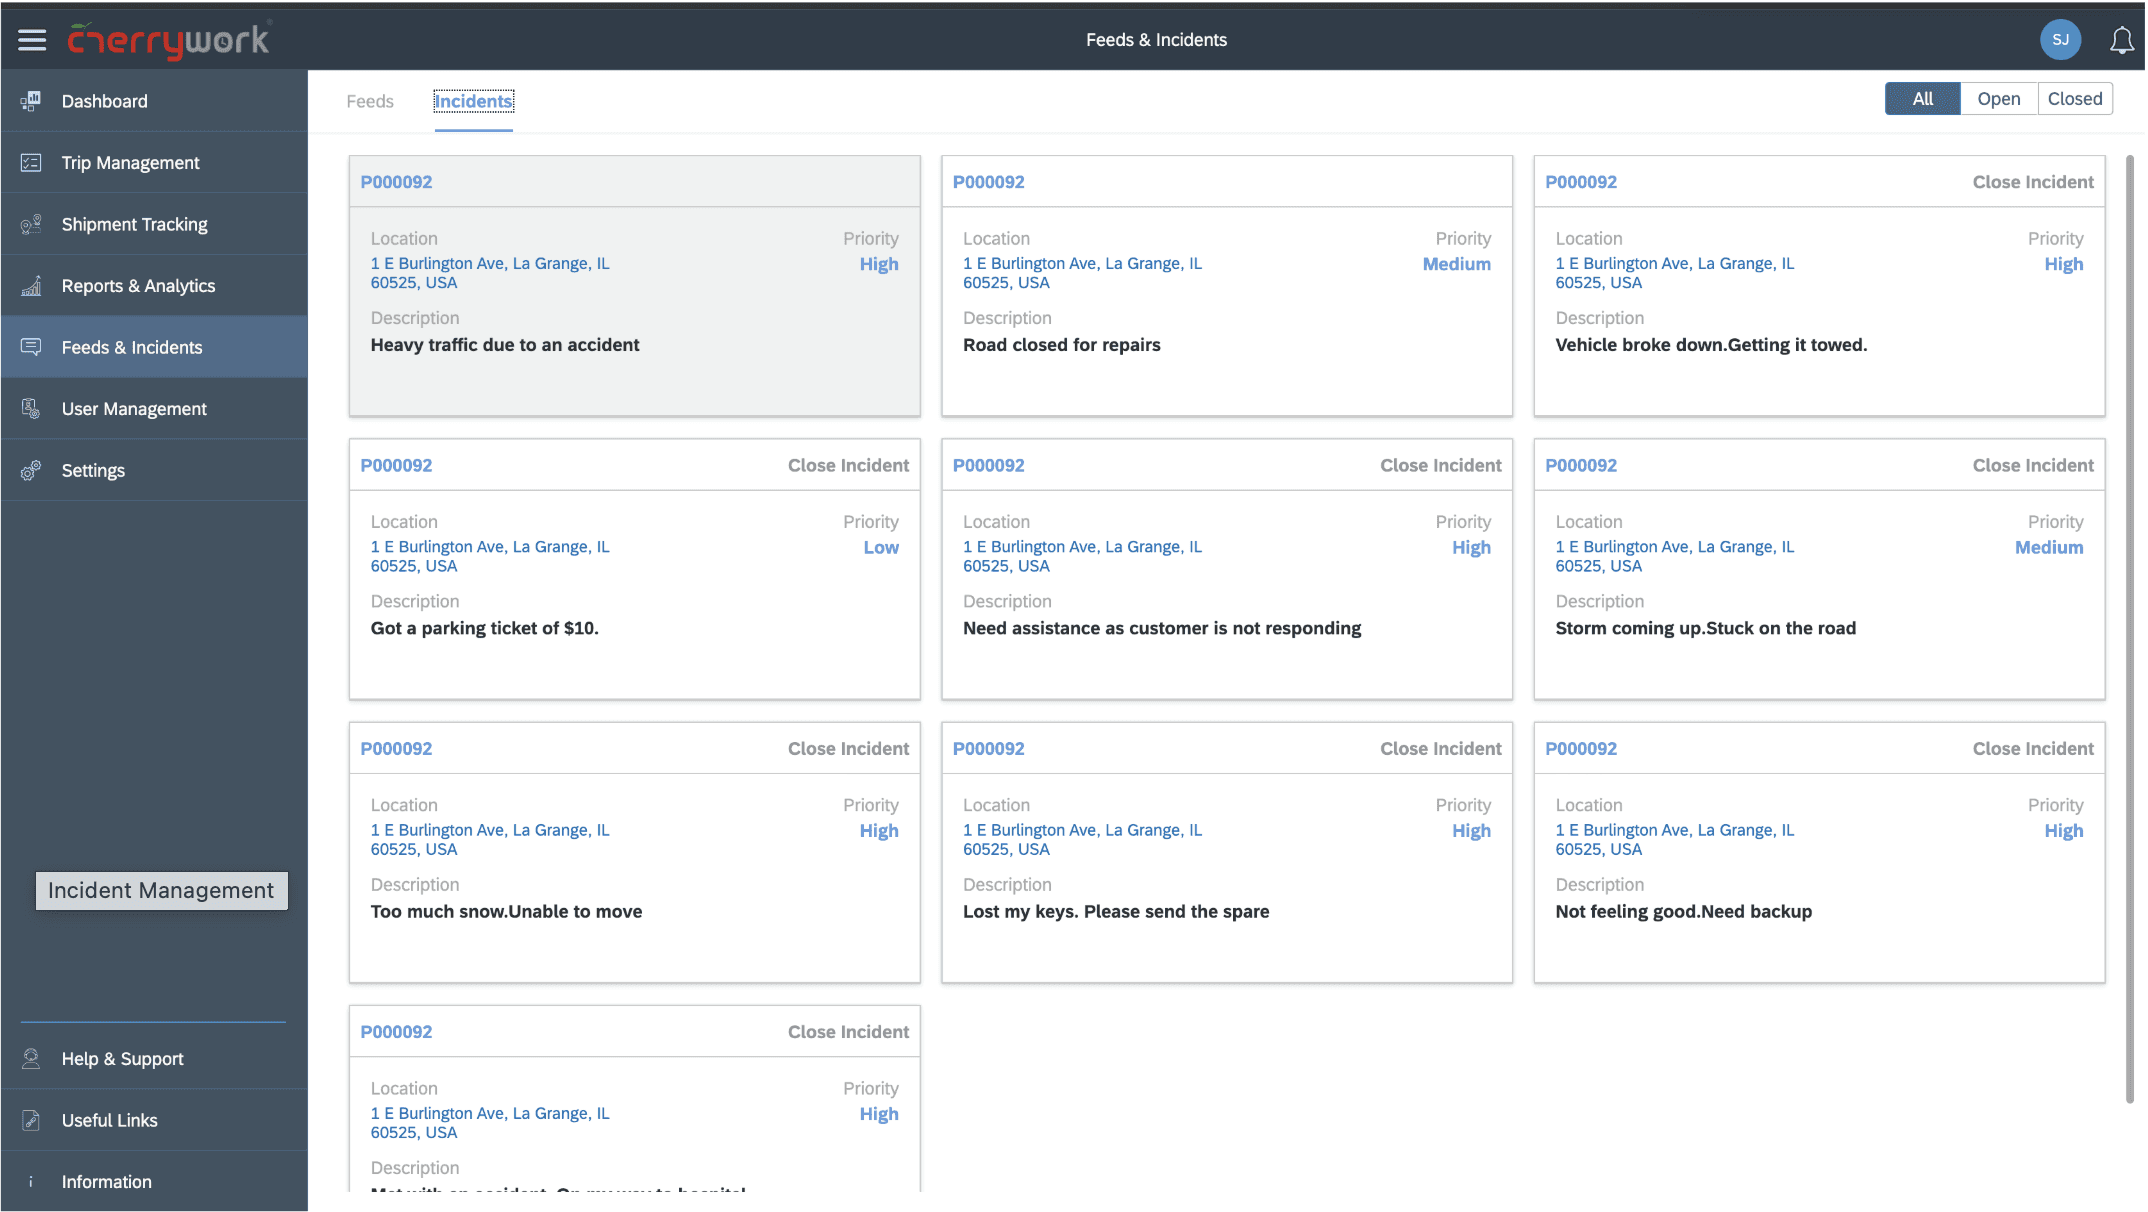
Feeds & Incidents
Delivery agents can raise incidents to inform dispatchers of an untoward events and receive assistance from team members and supervisors. Customers are better aware of the delays, thus building transparency and increasing customer satisfaction.
Real-time feed announcements
Instant incident notifications
Phase 5: Test & Iterate
Usability Testing
We tested with 6 delivery agents and 4 dispatchers to validate our assumptions. The feedback loop was critical for refining the product.
QR Code Scanning
Issue
Drivers struggled with glare in bright sunlight.
Solution
Added manual entry option + high contrast mode.
Notification Fatigue
Issue
Dispatchers overwhelmed by minor updates.
Solution
Implemented priority levels for alerts.
Offline Mode
Issue
Drivers unsure if data was saved.
Solution
Added clear sync indicators & feedback.
The Outcome
Business Impact
Tangible business outcomes within the first 3 months of deployment.
100%
Paperless Operations
30%
Efficiency Increase
200+
Active Drivers
$8k
Quarterly Savings
Sarah J., Operations Director
"
"This app fundamentally changed how we operate. We went from reactive fire-fighting to proactive fleet management overnight. The drivers love the simplicity, and we love the visibility."
Conclusion
Learnings & Next Steps
Every project teaches us something new. Here's what I took away from this experience.
Field Research is King
Shadowing drivers revealed critical usability issues (like screen glare and one-handed usage) that we would have missed in a lab setting.
Iterative Reviews
Weekly syncs with stakeholders prevented scope creep and ensured the product remained aligned with business goals.
Phased Rollout
Launching with a pilot group of 5 drivers allowed us to catch bugs and refine workflows before the full fleet deployment.
Ready to transform your logistics?
I specialize in building complex enterprise tools with consumer-grade UX. Let's discuss your next project.

Client
e-Grocery Chain US
Role
UX UI Designer
Duration
3 Months
Platform
Mobile App & Web Dashboard
100%
Paperless Operations
30%
Efficiency Increase
200+
Active Drivers
$8k
Quarterly Savings
Business Impact
Digitizing the Last Mile for Busiest e-Grocery store management
A prominent e-grocery chain operating in the New York City Metropolitan area faced significant operational inefficiencies. Their paper-based order tracking system created bottlenecks, limited visibility, and hindered communication between sales teams, delivery agents, and warehouse supervisors.
The Core Problem
"Delivery agents and warehouse supervisors need a streamlined digital solution that provides real-time visibility and efficient order management because the current paper-based system creates operational inefficiencies, reduces customer satisfaction, and increases delivery costs."
Key Pain Points
No Real-Time Visibility
Dispatchers had zero insight into driver locations, incidents or delivery status.
Paper-Based Chaos
Manual processes caused delays, lost receipts, and high error rates.
Inefficient Routing
Drivers wasted time on unoptimized routes and locating addresses.
Communication Gaps
Limited contact between delivery teams and dispatchers led to reactive problem-solving.
Key Pain Points
No Real-Time Visibility
Dispatchers had zero insight into driver locations, incidents or delivery status.
Paper-Based Chaos
Manual processes caused delays, lost receipts, and high error rates.
Inefficient Routing
Drivers wasted time on unoptimized routes and locating addresses.
Communication Gaps
Limited contact between delivery teams and dispatchers led to reactive problem-solving.
Phase 1: Discovery
Research & Findings
We conducted deep-dive research to understand the ecosystem. This wasn't just about building an app; it was about understanding the human element in a high-pressure logistics environment.
Stakeholder Interviews
10+ interviews with Warehouse Supervisors, Dispatchers, and Delivery Agents.
Field Observation
Shadowed 12 delivery routes and observed peak-hour warehouse operations.
Competitive Analysis
Benchmarked against Instacart, Amazon Fresh, and DoorDash systems.
Critical Insights
1
Delivery Agents
•
Spent 15+ mins/delivery locating addresses and routes.
•
Paper orders caused confusion and errors.
•
No way to communicate delays in real-time if any incident happens.
2
Dispatchers
•
Zero visibility into driver locations.
•
Relied on phone calls for tracking.
•
Assigning the deliveries to delivery agents based on locations
M
Marco
Delivery Agent • 28 years old
"I just want to get my deliveries done without getting lost or dealing with angry customers because I'm late."
Pain Points
Lost Paperwork
Unclear Addresses
No Proof of Delivery
S
Sarah
Dispatch Supervisor • 35 years old
"I need to know where my drivers are so I can manage customer expectations and optimize routes on the fly. And I want to assign the deliveries to agent based on one direction route"
Pain Points
No Visibility
Manual Reporting
Delivery assigning
Phase 2: Define
Success Metrics
We established clear, measurable goals to ensure the solution delivered tangible business value.
Operational Efficiency
Eliminate 100% of paper processes
Reduce delivery time by 20%
Increase daily capacity by 15%
Visibility & Communication
360° real-time visibility
Reduce communication time by 40%
Instant status updates
Business Impact
Reduce operational costs by 25%
Improve CSAT scores by 30%
Decrease incidents by 50%
Target Outcomes
40%
Reduction in communication time
100%
Paperless Operations
Phase 3: Ideate
User Flows & Architecture
Design Principles
Mood Board
We mapped out the entire delivery lifecycle to identify critical touchpoints and minimize friction for drivers
We mapped out the entire delivery tasks for admin and drivers
Driver Journey
1
Logs in & Views Assigned Trips
2
Scans Order QR Code (Verification)
3
Navigates to Address (GPS)
4
Arrives & Updates Status
5
Captures Photo + Signature (POD)
6
Confirms Delivery & Moves to Next
Dispatcher Journey
1
Logs in to Admin Dashboard
2
Creates Trip & Assigns Driver
3
Adds Orders via Geo-fencing
4
Monitors Live Fleet Progress
5
Receives Delay Alerts
6
Resolves Incidents via Workbench
Principle 1
Visibility First
Every stakeholder should have real-time access to relevant delivery info.
Principle 2
Simplicity in Motion
Drivers need one-hand operation with large touch targets while on the move.
Principle 3
Error Prevention
Built-in validation (QR scanning) prevents wrong deliveries before they happen.
Phase 4: Design & Prototype
The Solution
A comprehensive dual-platform ecosystem designed for clarity, speed, and reliability.
SAP Fiori Design System
Driver App
Designed for the Road
Dashboard to check shipments & routes
High contrast for outdoor visibility
Offline-first architecture
One-tap navigation integration
One-tap help assistance
Admin Dashboard
Command Center
Provides warehouse supervisors or dispatchers with real-time view of delivery agents, shipments, vehicles and customer's proof of delivery. Features include drag-and-drop trip assignment and real-time incident alerts.

Real-time fleet tracking map
Instant incident notifications
Performance analytics dashboard
Trip Management
Improved delivery efficiency by enabling geofenced trip creation, real-time trip tracking, and structured rejection workflows to help supervisors meet daily delivery quotas
Drag-and-drop route optimization
Manifest the upcoming trips
Feeds & Incidents
Delivery agents can raise incidents to inform dispatchers of an untoward events and receive assistance from team members and supervisors. Customers are better aware of the delays, thus building transparency and increasing customer satisfaction.
Real-time feed announcements
Instant incident notifications
Phase 5: Test & Iterate
Usability Testing
We tested with 6 delivery agents and 4 dispatchers to validate our assumptions. The feedback loop was critical for refining the product.
QR Code Scanning
Issue
Drivers struggled with glare in bright sunlight.
Solution
Added manual entry option + high contrast mode.
Notification Fatigue
Issue
Dispatchers overwhelmed by minor updates.
Solution
Implemented priority levels for alerts.
Offline Mode
Issue
Drivers unsure if data was saved.
Solution
Added clear sync indicators & feedback.
Conclusion
Learnings & Next Steps
Every project teaches us something new. Here's what I took away from this experience.
Field Research is King
Shadowing drivers revealed critical usability issues (like screen glare and one-handed usage) that we would have missed in a lab setting.
Iterative Reviews
Weekly syncs with stakeholders prevented scope creep and ensured the product remained aligned with business goals.
Phased Rollout
Launching with a pilot group of 5 drivers allowed us to catch bugs and refine workflows before the full fleet deployment.
Ready to transform your logistics?
I specialize in building complex enterprise tools with consumer-grade UX. Let's discuss your next project.
The Outcome
Business Impact
Tangible business outcomes within the first 3 months of deployment.
100%
Paperless Operations
30%
Efficiency Increase
200+
Active Drivers
$8k
Quarterly Savings
"This app fundamentally changed how we operate. We went from reactive fire-fighting to proactive fleet management overnight. The drivers love the simplicity, and we love the visibility."
— Sarah J., Operations Director
"
Phase 2: Define
Success Metrics
We established clear, measurable goals to ensure the solution delivered tangible business value.
Operational Efficiency
Eliminate 100% of paper processes
Reduce delivery time by 20%
Increase daily capacity by 15%
Visibility & Communication
360° real-time visibility
Reduce communication time by 40%
Instant status updates
Business Impact
Reduce operational costs by 25%
Improve CSAT scores by 30%
Decrease incidents by 50%
Target Outcomes
40%
Reduction in communication time
100%
Paperless Operations
Phase 3: Ideate
User Flows & Architecture
Design Principles
Mood Board
We mapped out the entire delivery tasks for admin and drivers.
We mapped out the entire delivery lifecycle to identify critical touchpoints and minimize friction for drivers.
Driver Journey
1
Logs in & Views Assigned Trips
2
Scans Order QR Code (Verification)
3
Navigates to Address (GPS)
4
Arrives & Updates Status
5
Captures Photo + Signature (POD)
6
Confirms Delivery & Moves to Next
Dispatcher Journey
1
Logs in to Admin Dashboard
2
Creates Trip & Assigns Driver
3
Adds Orders via Geo-fencing
4
Monitors Live Fleet Progress
5
Receives Delay Alerts
6
Resolves Incidents via Workbench
Principle 1
Visibility First
Every stakeholder should have real-time access to relevant delivery info.
Principle 2
Simplicity in Motion
Drivers need one-hand operation with large touch targets while on the move.
Principle 3
Error Prevention
Built-in validation (QR scanning) prevents wrong deliveries before they happen.
Phase 4: Design & Prototype
The Solution
A comprehensive dual-platform ecosystem designed for clarity, speed, and reliability.
Visual System
Driver App
Designed for the Road
Dashboard to check shipments & routes
High contrast for outdoor visibility
Offline-first architecture
One-tap navigation integration
One-tap help assistance
Admin Dashboard
Command Center
Provides warehouse supervisors or dispatchers with real-time view of delivery agents, shipments, vehicles and customer's proof of delivery. Features include drag-and-drop trip assignment and real-time incident alerts.
Real-time fleet tracking map
Instant incident notifications
Performance analytics dashboard
Trip Management
Improved delivery efficiency by enabling geofenced trip creation, real-time trip tracking, and structured rejection workflows to help supervisors meet daily delivery quotas
Drag-and-drop route optimization
Manifest the upcoming trips
Feeds & Incidents
Delivery agents can raise incidents to inform dispatchers of an untoward events and receive assistance from team members and supervisors. Customers are better aware of the delays, thus building transparency and increasing customer satisfaction.
Real-time feed announcements
Instant incident notifications
Phase 5: Test & Iterate
Usability Testing
We tested with 6 delivery agents and 4 dispatchers to validate our assumptions. The feedback loop was critical for refining the product.
QR Code Scanning
Issue
Drivers struggled with glare in bright sunlight.
Solution
Added manual entry option + high contrast mode.
Notification Fatigue
Issue
Dispatchers overwhelmed by minor updates.
Solution
Implemented priority levels for alerts.
Offline Mode
Issue
Drivers unsure if data was saved.
Solution
Added clear sync indicators & feedback.
The Outcome
Business Impact
Tangible business outcomes within the first 3 months of deployment.
100%
Paperless Operations
30%
Efficiency Increase
200+
Active Drivers
$8k
Quarterly Savings
"This app fundamentally changed how we operate. We went from reactive fire-fighting to proactive fleet management overnight. The drivers love the simplicity, and we love the visibility."
— Sarah J., Operations Director
"
Conclusion
Learnings & Next Steps
Every project teaches us something new. Here's what I took away from this experience.
Field Research is King
Shadowing drivers revealed critical usability issues (like screen glare and one-handed usage) that we would have missed in a lab setting.
Iterative Reviews
Weekly syncs with stakeholders prevented scope creep and ensured the product remained aligned with business goals.
Phased Rollout
Launching with a pilot group of 5 drivers allowed us to catch bugs and refine workflows before the full fleet deployment.
Ready to transform your logistics?
I specialize in building complex enterprise tools with consumer-grade UX. Let's discuss your next project.
Proof of Delivery
Transforming last-mile logistics for a leading NYC e-grocery chain through digital innovation and user-centered design.
Mobile & Web
5 Months
Incture Technologies Pvt Ltd
M
Marco
Delivery Agent • 28 years old
"I just want to get my deliveries done without getting lost or dealing with angry customers because I'm late."
Pain Points
Lost Paperwork
Unclear Addresses
No Proof of Delivery
S
Sarah
Dispatch Supervisor • 35 years old
"I need to know where my drivers are so I can manage customer expectations and optimize routes on the fly. And I want to assign the deliveries to agent based on one direction route"
Pain Points
No Visibility
Manual Reporting
Delivery assigning
Conclusion
Learnings & Next Steps
Every project teaches us something new. Here's what I took away from this experience.
Field Research is King
Shadowing drivers revealed critical usability issues (like screen glare and one-handed usage) that we would have missed in a lab setting.
Iterative Reviews
Weekly syncs with stakeholders prevented scope creep and ensured the product remained aligned with business goals.
Phased Rollout
Launching with a pilot group of 5 drivers allowed us to catch bugs and refine workflows before the full fleet deployment.
Ready to transform your logistics?
I specialize in building complex enterprise tools with consumer-grade UX. Let's discuss your next project.
Proof of Delivery
Transforming last-mile logistics for a leading NYC e-grocery chain through digital innovation and user-centered design.
Mobile & Web
3 Months
Incture Technologies Pvt Ltd
Client
e-Grocery Chain US
Role
UX UI Designer
Duration
5 Months
Platform
Mobile & Web

Business Impact
100%
Paperless Operations
30%
Efficiency Increase
200+
Active Drivers
$8k
Quarterly Savings
Digitizing the Last Mile for Busiest e-Grocery store management
A prominent e-grocery chain operating in the New York City Metropolitan area faced significant operational inefficiencies. Their paper-based order tracking system created bottlenecks, limited visibility, and hindered communication between sales teams, delivery agents, and warehouse supervisors.
The Core Problem
"Delivery agents and warehouse supervisors need a streamlined digital solution that provides real-time visibility and efficient order management because the current paper-based system creates operational inefficiencies, reduces customer satisfaction, and increases delivery costs."
Key Pain Points
No Real-Time Visibility
Dispatchers had zero insight into driver locations, incidents or delivery status.
Paper-Based Chaos
Manual processes caused delays, lost receipts, and high error rates.
Inefficient Routing
Drivers wasted time on unoptimized routes and locating addresses.
Communication Gaps
Limited contact between delivery teams and dispatchers led to reactive problem-solving.
Phase 1: Discovery
Research & Findings
We conducted deep-dive research to understand the ecosystem. This wasn't just about building an app; it was about understanding the human element in a high-pressure logistics environment.
Stakeholder Interviews
10+ interviews with Warehouse Supervisors, Dispatchers, and Delivery Agents.
Field Observation
Shadowed 12 delivery routes and observed peak-hour warehouse operations.
Competitive Analysis
Benchmarked against Instacart, Amazon Fresh, and DoorDash systems.
Critical Insights
1
Delivery Agents
•
Spent 15+ mins/delivery locating addresses and routes.
•
Paper orders caused confusion and errors.
•
No way to communicate delays in real-time if any incident happens.
2
Dispatchers
•
Zero visibility into driver locations.
•
Relied on phone calls for tracking.
•
Assigning the deliveries to delivery agents based on locations
M
Marco
Delivery Agent • 28 years old
"I just want to get my deliveries done without getting lost or dealing with angry customers because I'm late."
Pain Points
Lost Paperwork
Unclear Addresses
No Proof of Delivery
S
Sarah
Dispatch Supervisor • 35 years old
"I need to know where my drivers are so I can manage customer expectations and optimize routes on the fly. And I want to assign the deliveries to agent based on one direction route"
Pain Points
No Visibility
Manual Reporting
Delivery assigning
Phase 2: Define
Success Metrics
We established clear, measurable goals to ensure the solution delivered tangible business value.
Operational Efficiency
Eliminate 100% of paper processes
Reduce delivery time by 20%
Increase daily capacity by 15%
Visibility & Communication
360° real-time visibility
Reduce communication time by 40%
Instant status updates
Business Impact
Reduce operational costs by 25%
Improve CSAT scores by 30%
Decrease incidents by 50%
Target Outcomes
40%
Reduction in communication time
100%
Paperless Operations
Phase 3: Ideate
Driver Journey
1
Logs in & Views Assigned Trips
2
Scans Order QR Code (Verification)
3
Navigates to Address (GPS)
4
Arrives & Updates Status
5
Captures Photo + Signature (POD)
6
Confirms Delivery & Moves to Next
Dispatcher Journey
1
Logs in to Admin Dashboard
2
Creates Trip & Assigns Driver
3
Adds Orders via Geo-fencing
4
Monitors Live Fleet Progress
5
Receives Delay Alerts
6
Resolves Incidents via Workbench
Principle 1
Visibility First
Every stakeholder should have real-time access to relevant delivery info.
Principle 2
Simplicity in Motion
Drivers need one-hand operation with large touch targets while on the move.
Principle 3
Error Prevention
Built-in validation (QR scanning) prevents wrong deliveries before they happen.
Mood Board
We mapped out the entire delivery tasks for admin and drivers.
User Flows & Architecture
We mapped out the entire delivery lifecycle to identify critical touchpoints and minimize friction for drivers.
Design Principles
Phase 4: Design & Prototype
The Solution
A comprehensive dual-platform ecosystem designed for clarity, speed, and reliability.
SAP Fiori Design System
Driver App
Designed for the Road
Dashboard to check shipments & routes
High contrast for outdoor visibility
Offline-first architecture
One-tap navigation integration
One-tap help assistance
Admin Dashboard
Command Center

Provides warehouse supervisors or dispatchers with real-time view of delivery agents, shipments, vehicles and customer's proof of delivery. Features include drag-and-drop trip assignment and real-time incident alerts.
Real-time fleet tracking map
Instant incident notifications
Performance analytics dashboard
Drag-and-drop trip assignments
Trip Management
Improved delivery efficiency by enabling geofenced trip creation, real-time trip tracking, and structured rejection workflows to help supervisors meet daily delivery quotas
Drag-and-drop route optimization
Manifest the upcoming trips
Feeds & Incidents
Delivery agents can raise incidents to inform dispatchers of an untoward events and receive assistance from team members and supervisors. Customers are better aware of the delays, thus building transparency and increasing customer satisfaction.
Real-time feed announcements
Instant incident notifications
Phase 5: Test & Iterate
Usability Testing
We tested with 6 delivery agents and 4 dispatchers to validate our assumptions. The feedback loop was critical for refining the product.
QR Code Scanning
Issue
Drivers struggled with glare in bright sunlight.
Solution
Added manual entry option + high contrast mode.
Notification Fatigue
Issue
Dispatchers overwhelmed by minor updates.
Solution
Implemented priority levels for alerts.
Offline Mode
Issue
Drivers unsure if data was saved.
Solution
Added clear sync indicators & feedback.
Conclusion
Learnings & Next Steps
Every project teaches us something new. Here's what I took away from this experience.
Field Research is King
Shadowing drivers revealed critical usability issues (like screen glare and one-handed usage) that we would have missed in a lab setting.
Iterative Reviews
Weekly syncs with stakeholders prevented scope creep and ensured the product remained aligned with business goals.
Phased Rollout
Launching with a pilot group of 5 drivers allowed us to catch bugs and refine workflows before the full fleet deployment.
Ready to transform your logistics?
I specialize in building complex enterprise tools with consumer-grade UX. Let's discuss your next project.
The Outcome
Business Impact
Tangible business outcomes within the first 3 months of deployment.
100%
Paperless Operations
30%
Efficiency Increase
200+
Active Drivers
$8k
Quarterly Savings
"This app fundamentally changed how we operate. We went from reactive fire-fighting to proactive fleet management overnight. The drivers love the simplicity, and we love the visibility."
— Sarah J., Operations Director
"